Using at least 20 data points provided by your counselor, create a subsurface structure map and use it to explain how subsurface geology maps are used to find oil, gas, or coal resources.
This is one of the most authentic geology tasks in the badge. You are taking scattered data points — probably depths or elevations from wells — and turning them into a map that shows the shape of a buried surface. That is exactly the kind of interpretation geologists use when searching for resources.
What a Structure Map Shows
A structure map connects equal values, often with contour lines, to reveal highs, lows, folds, and closures on a buried rock layer. If the buried layer arches upward into a dome or anticline and has the right rock properties, it may help form a trap.
Basic Workflow
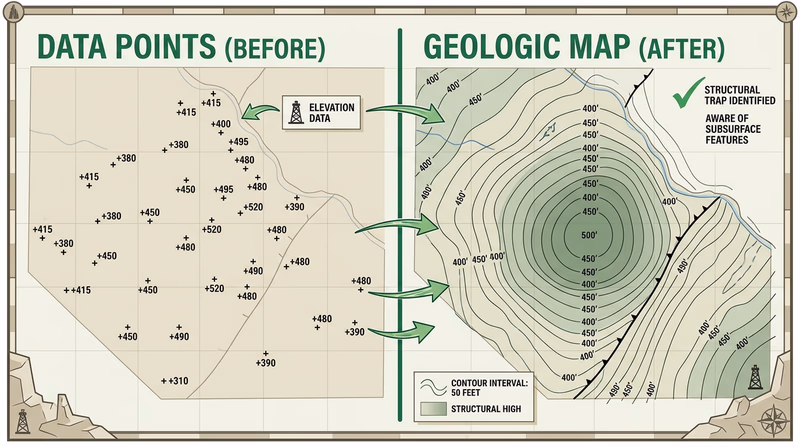
Plot each counselor-provided data point in the correct location.
Write the value at each point.
Look for the general pattern of increasing and decreasing values.
Structural highs may be promising places for accumulated oil or gas.
Structural lows can show basins or deeper parts of the subsurface.
Closed contours may indicate domes or traps.
Abrupt pattern changes may suggest a fault or other structure.
Explain Your Finished Map
What your counselor will want to hear
What buried surface did you map?
Where are the highs and lows?
Do the contours suggest a fold, fault, dome, or basin?
Why could this matter for oil, gas, or coal?
What additional data would make the interpretation stronger?
If you did Req 3 carefully, you already have a head start. Both geologic maps and subsurface maps depend on the same habit: turning patterns into explanations supported by evidence.
Official Resources
There is no official resource link for this page, so focus on your counselor’s data set and your own mapping work.
You are almost done with the Energy Resources option. The last step is choosing whether to present what you learned or visit a real drilling operation.