Oceanography Merit Badge — Complete Digital Resource Guide
https://merit-badge.university/merit-badges/oceanography/guide/
Introduction & Overview
The ocean covers more than 70 percent of Earth, shapes weather on every continent, feeds millions of people, and hides mountain ranges, trenches, and living things that scientists are still discovering. Oceanography is the science of all of that together — water, seafloor, chemistry, weather, and life.
This badge is fun because it makes you look at the ocean as one giant connected system. Even if you live far from the coast, the ocean still affects your climate, your food, and the air you breathe.
Then and Now
Then
People have studied the ocean for thousands of years, but early sailors mostly wanted practical answers: Where are the currents? Which winds can move a ship? How deep is the water near shore? Ancient Polynesian navigators read waves and stars to cross huge stretches of ocean. Later, explorers lowered weighted lines to measure depth and sketched coastlines by hand.
Ocean science changed in the 1800s when research expeditions began collecting water samples, recording temperatures, dredging up seafloor animals, and mapping the deep ocean. Instead of seeing the sea as a blank blue space on a map, scientists started discovering trenches, ridges, and entire ecosystems.
Now
Today, oceanographers use satellites, drifting buoys, sonar, underwater robots, and research vessels to study places humans cannot easily reach. They track hurricanes from space, map the seafloor in detail, measure tiny changes in seawater chemistry, and explore deep-sea habitats that have never been seen before.
Modern oceanography matters because the ocean stores heat, moves carbon, supports food webs, and connects every coastline on Earth. A storm near one part of the world, melting ice in another, or a plankton bloom far offshore can all matter to people far away.
Get Ready!
You do not need to own a boat or live beside the ocean to start thinking like an oceanographer. Bring curiosity, clear notes, and a willingness to observe patterns. This guide will help you break a huge subject into manageable parts.
Kinds of Oceanography
Oceanography is really several sciences working together.
Physical Oceanography
Physical oceanographers study waves, tides, currents, density, and how the ocean moves heat around the planet. If you want to understand rip currents, storm surge, or how the ocean affects climate, you are thinking like a physical oceanographer.
Chemical Oceanography
Chemical oceanographers study what is dissolved in seawater and how ocean chemistry changes. That includes salts, gases like oxygen and carbon dioxide, nutrients, pollution, and how water chemistry affects marine life.
Geological Oceanography
Geological oceanographers focus on the seafloor and coastlines. They study trenches, ridges, sediment, underwater volcanoes, coral reef growth, and how waves and currents reshape coasts over time.
Biological Oceanography
Biological oceanographers study life in the ocean, from tiny phytoplankton to giant whales. They ask how organisms survive in seawater, where they live, how food chains work, and how ocean habitats change.
Now that you know the main branches of oceanography, you are ready to start with the big picture: what oceanographers study and why learning about the ocean matters.
Req 1 — Branches of Oceanography
When people hear “oceanography,” they sometimes picture only scuba divers or scientists on ships. The field is much bigger than that. Oceanography combines several kinds of science so people can understand how the ocean moves, what it is made of, what lives in it, and what the seafloor looks like.
The Four Main Branches
A simple way to remember the four branches is to think about motion, chemistry, landforms, and life.
Physical Oceanography
This branch studies how ocean water moves and changes. It includes waves, tides, currents, density, water temperature, and how the ocean affects weather and climate. When you learn about rip currents or El Niño, you are in the world of physical oceanography.
Chemical Oceanography
This branch studies what seawater contains and how those ingredients change. Chemical oceanographers measure salt, oxygen, nutrients, carbon dioxide, and pollutants. They want to know how seawater chemistry affects living things and how the ocean stores and moves chemicals around the planet.
Geological Oceanography
This branch studies the ocean floor and coastlines. Geological oceanographers map trenches, ridges, underwater volcanoes, beaches, and sediment movement. They also study how coral reefs and islands form and how waves reshape shorelines.
Biological Oceanography
This branch studies ocean life, from tiny plankton to giant whales. Biological oceanographers ask where organisms live, what they eat, how food chains work, and how changes in temperature or chemistry affect marine ecosystems.
A Quick Way to Tell the Branches Apart
Match the question to the branch- How does water move? Physical oceanography.
- What is dissolved in seawater? Chemical oceanography.
- What does the seafloor look like? Geological oceanography.
- What lives there, and how do food webs work? Biological oceanography.
Why Learning About the Ocean Matters
You need at least five reasons, but you will probably think of more once you start looking.
1. The ocean affects weather and climate
The ocean absorbs heat from the Sun and moves that heat around Earth through currents. Warm and cool ocean waters can change rainfall, storm strength, and temperature patterns far inland.
2. The ocean helps make life possible
Ocean phytoplankton produce a huge share of Earth’s oxygen through photosynthesis. The ocean also stores carbon and helps regulate planetary temperature.
3. People depend on the ocean for food and jobs
Fishing, shipping, tourism, marine construction, weather forecasting, naval operations, and scientific research all depend on understanding the sea.
4. The ocean shapes coastlines and communities
Storm surge, erosion, flooding, and sediment movement affect where people can safely live and build. Learning ocean science helps communities prepare.
5. The ocean is full of living systems worth protecting
Coral reefs, kelp forests, estuaries, and deep-sea habitats support amazing biodiversity. Oceanography helps people notice when those systems are healthy or in trouble.
6. The ocean is still not fully explored
Scientists have mapped much of the Moon and Mars in surprising detail, yet large parts of Earth’s seafloor remain less familiar. There are still unknown habitats, species, and processes waiting to be studied.
Putting It All Together
The strongest answer for your counselor will not be just a memorized list. Try to connect each branch to a real example. A hurricane forecast involves physical oceanography. Measuring salt content involves chemical oceanography. Mapping a trench involves geological oceanography. Studying plankton blooms involves biological oceanography.
🎬 Video: What is Oceanography (video) — https://youtu.be/NMM_GboBZyc?si=xq_9tR0kLLbCYoQo
Now that you know the big branches of the field, the next step is learning how seawater behaves and why that behavior matters for currents, weather, and climate.
Req 2 — Seawater, Currents & Climate
A glass of ocean water may look simple, but it holds clues about heat, salt, motion, and weather. This requirement is about the basic properties that help oceanographers explain why some water sinks, some rises, and some travels across whole ocean basins.
Three Key Properties of Seawater
Salinity
Salinity is the amount of dissolved salts in water. Ocean water is salty because minerals from rocks wash into rivers and eventually reach the sea. Water can evaporate, but the salts stay behind. Places with heavy evaporation often become saltier, while places with lots of rain, melting ice, or river input can become less salty.
Temperature
Temperature tells how warm or cold the water is. Surface water is usually warmed by sunlight, but deeper water can stay much colder. Temperature matters because it affects density, weather, and which organisms can live in different parts of the ocean.
Density
Density means how much mass is packed into a certain volume. In the ocean, colder water is usually denser than warmer water, and saltier water is denser than fresher water. Dense water tends to sink below less-dense water.
How Oceanographers Measure These Properties
Oceanographers use instruments, not guesswork.
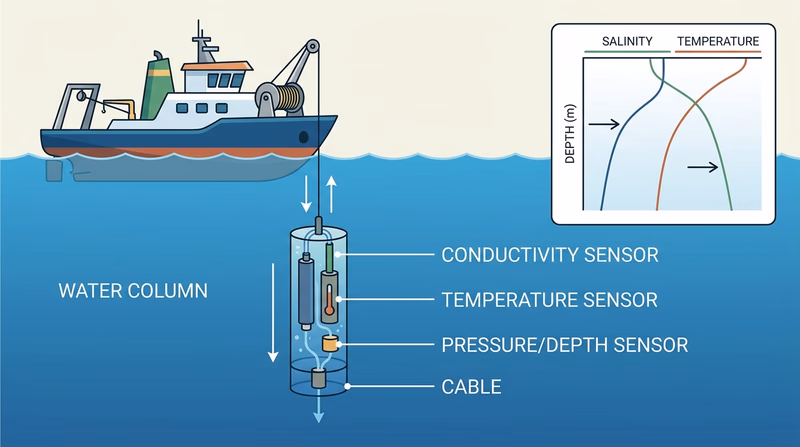
- Salinity is often measured with conductivity sensors. Saltier water carries electricity better, so conductivity helps scientists calculate salinity.
- Temperature is measured with accurate electronic thermometers or temperature probes.
- Density is usually calculated from temperature, salinity, and pressure rather than measured by one simple handheld tool.
One common package of instruments is called a CTD, which stands for conductivity, temperature, and depth. A CTD can be lowered from a research ship and record conditions from the surface to deep water.
🎬 Video: Temperature and Salinity (video) — https://youtu.be/jKWc5oy0NCQ?si=2B4crDCxvuYbGQce
Currents and Circulation
The ocean does not sit still. Surface winds push water, Earth’s rotation bends moving water, and differences in density help drive deep circulation.
Surface currents
Surface currents are driven mostly by wind. They form large circular patterns called gyres in major ocean basins. These currents help move warm water away from the equator and cooler water toward it.
Deep circulation
Deep circulation is driven mainly by density differences. In cold regions near the poles, very dense water can sink and begin long, slow journeys through the deep ocean. This global movement is sometimes called the global conveyor belt.
Why currents matter
Currents move heat, nutrients, organisms, and even floating debris. They can make one coast milder, another foggier, and another more productive for fishing.
🎬 Video: An Ocean in Motion (video) — https://youtu.be/R5-s6O8qyvE
What Drives Ocean Circulation?
Four forces to remember- Wind pushes surface water.
- Earth’s rotation bends moving water through the Coriolis effect.
- Density differences make some water sink and other water rise.
- Continents and seafloor shape steer currents into patterns instead of straight lines.
How the Ocean Affects Weather and Climate
The ocean stores enormous amounts of heat. Water warms and cools more slowly than land, so the sea acts like a giant temperature buffer.
That means the ocean can:
- make coastal climates less extreme than inland climates
- feed moisture into storms
- strengthen or weaken hurricanes depending on sea-surface temperature
- influence droughts, rainfall, and seasonal weather patterns
- shape long-term climate patterns such as El Niño and La Niña
Warm ocean water adds energy and moisture to the atmosphere. Cold currents can cool nearby air and even help create fog. Because the ocean covers so much of Earth, changes in ocean temperature can influence weather far from the coast.
🎬 Video: Oceans and Climate (video) — https://youtu.be/zO2153cJORI
🎬 Video: How Do Ocean Currents Affect the Weather Pattern? (video) — https://youtu.be/T9LTtqcKDw0?si=qNZusyjB_bPjS0UQ
How to Explain This to Your Counselor
If you want a clear discussion, try this sequence:
- Define salinity, temperature, and density.
- Explain that salinity and temperature help determine density.
- Show how density differences help drive circulation.
- Connect circulation to heat transport.
- Connect heat transport to weather and climate.
That gives your explanation a chain of cause and effect instead of a list of unrelated facts.
Now that you understand how water properties and circulation work, you are ready to look at one of the ocean’s most visible forms of motion: waves.
Req 3 — Waves, Breakers & Rip Currents
Waves are moving energy, not giant lumps of water traveling unchanged across the sea. This requirement covers four important ideas: dangerous surge events, the difference between sea and swell, how breakers form, and how to stay safe around rip currents.
What to Watch When You Look at Waves
Four clues that tell you what the water is doing- Height: How tall are the waves from trough to crest?
- Length: How far apart are crests?
- Period: How much time passes between waves?
- Shape near shore: Are they steepening, breaking, or reforming?
🎬 Video: How Do Ocean Waves Work? (video) — https://youtu.be/_LRc6k-clzE?si=_bP0nKjcposT5QV5
Requirement 3a: Storm Surge, Tsunami, Tidal Wave & Tidal Bore
What each one is
A storm surge is an unusual rise in sea level pushed ashore by strong winds and low pressure during a storm, especially hurricanes. It floods coasts and can move far inland.
A tsunami is a series of large waves usually caused by an underwater earthquake, landslide, or volcanic event. Tsunamis can cross whole oceans and may look small offshore but become destructive in shallow coastal water.
A tidal wave is a confusing old phrase that people often use when they really mean tsunami. True everyday tides are caused mainly by gravity from the Moon and Sun, not by storms or earthquakes.
A tidal bore is a moving wall or surge of water that travels up a river or narrow inlet when an incoming tide is forced into a tight channel.
The big differences
- Storm surge comes from weather.
- Tsunami comes from sudden displacement of water, often geologic.
- Tidal wave is usually an inaccurate popular term.
- Tidal bore happens in certain rivers or estuaries during strong tides.
🎬 Video: Tsunami vs Tidal Wave: What's the Difference? (video) — https://youtu.be/wk7RyUReaIA
🎬 Video: What is Storm Surge? (video) — https://youtu.be/ZxYCB4VPVow
Requirement 3b: Sea, Swell & Surf
Sea usually means choppy waves created by local winds blowing over nearby water. They are often irregular and messy.
Swell is wave energy that has traveled away from the storm or wind that formed it. Swell waves are usually smoother, more organized, and more evenly spaced.
Surf is the zone near shore where waves break. It is what you see at the beach when incoming wave energy hits shallow water and topples over.
Weather Explained: What's the Difference Between Seas and Swell? (video) A quick visual explanation of why locally driven seas look different from organized swell. Link: Weather Explained: What's the Difference Between Seas and Swell? (video) — https://www.skynews.com.au/australia-news/weather-explained-whats-the-difference-between-seas-and-swell/video/836f58b40244e1a18c28b015033f9792 Difference Between Swell and Surf (website) A plain-language comparison that helps you separate incoming swell from breaking surf at the beach. Link: Difference Between Swell and Surf (website) — https://support.surfline.com/hc/en-us/articles/4410126820891-Difference-between-swell-and-surf🎬 Video: The Difference Between SWELL and SURF (video) — https://www.youtube.com/shorts/qcwAsh9TDvo
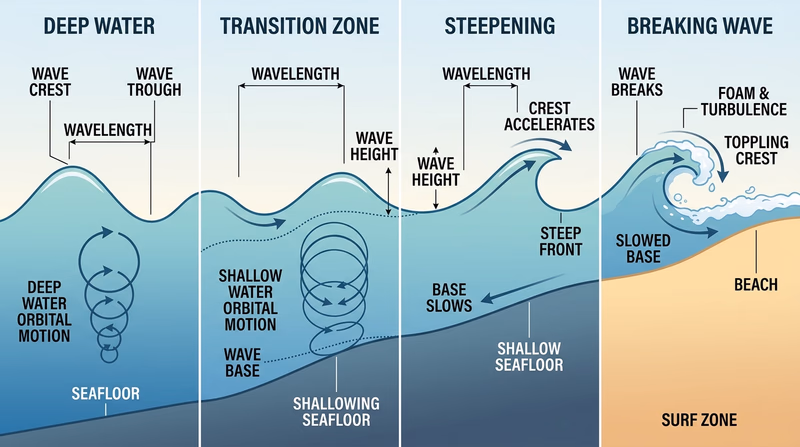
Requirement 3c: How Breakers Form
Out in deeper water, a wave can travel forward without breaking because the base of the wave is not dragging on the bottom. As the wave moves into shallow water, the lower part begins to slow down because of friction with the seafloor. The top keeps moving faster for a moment, the wave gets steeper, and eventually the crest spills or crashes forward. That is a breaker.
The slope of the beach matters too. Gentle slopes often produce spilling breakers. Steeper bottoms can create plunging breakers that curl and crash more dramatically.
🎬 Video: How Do Waves Break? (video) — https://www.youtube.com/watch?v=aXuQC1qRuEM
Requirement 3d: Rip Currents
A rip current is a narrow, fast-moving channel of water flowing away from shore. Waves pile water onto the beach, and that water has to return seaward somehow. Sometimes it escapes in a concentrated stream between sandbars or beside structures like piers.
How to avoid rip currents
- swim at beaches with lifeguards
- watch for posted warning flags
- avoid areas with a darker, calmer-looking gap between breaking waves
- stay away from piers, jetties, and sandbar cuts unless you understand local conditions
What to do if you are caught
Do not fight the current straight back to shore. That is how swimmers get exhausted.
Instead:
- Stay calm and float if needed.
- Swim parallel to shore until you leave the narrow current.
- Then angle back toward the beach.
- If you cannot swim out, wave and call for help while floating.
🎬 Video: New Guide to Spot and Escape a Rip Current (video) — https://youtu.be/lofVgAzut6w?si=At3-3C6bldcYJI5Q
Now that you understand moving water at the surface, the next step is to look below it at the landforms shaped by tectonics, sediment, and time.
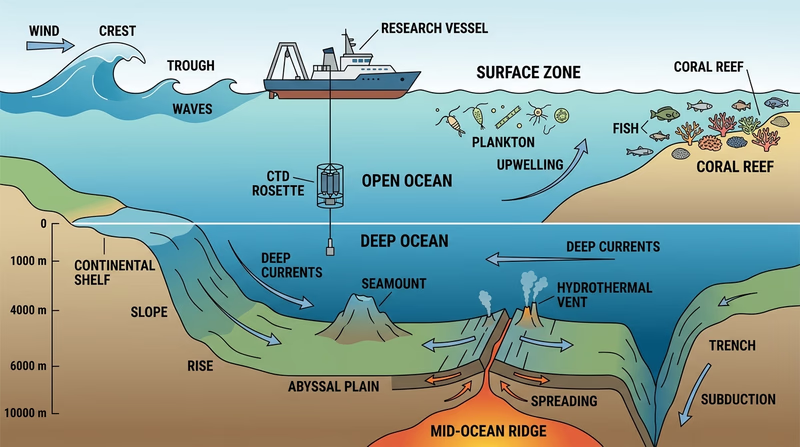
Req 4 — The Shape of the Seafloor
This requirement starts with a drawing because oceanography becomes much easier once you can picture the seafloor. Your cross-section should show the coast, shallow continental edge, steep drop-off, broad deep basin, and major underwater mountains and valleys.
Diagram of Sea Floor (website) A labeled seafloor diagram that helps you place each underwater feature in the right relative position. Link: Diagram of Sea Floor (website) — https://www.visualdictionaryonline.com/earth/geology/ocean-floor.php🎬 Video: How Deep Does the Ocean Go? (video) — https://youtu.be/mAwfTahzbtw
🎬 Video: How Deep the Ocean REALLY Is (video) — https://youtube.com/shorts/DZ9v54D4mZ8?si=l4pnMMCRDzgxQOpF
Building Your Cross-Section
A strong drawing does not need to look artistic. It needs to be clear.
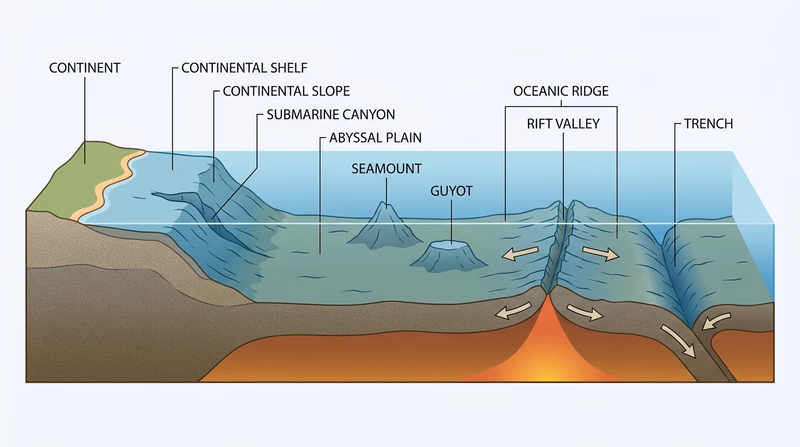
Start at land and move outward:
- coastline and shallow nearshore water
- continental shelf
- continental slope
- deep basin with an abyssal plain
- extra features such as trench, ridge, rift valley, seamount, guyot, and canyon
A seamount is an underwater mountain. A guyot is a flat-topped seamount, usually worn down near sea level long ago and then carried lower. An oceanic ridge is a long underwater mountain chain, often with a central rift valley where tectonic plates pull apart. A submarine canyon cuts into the continental margin. A trench is a very deep, narrow depression where one plate sinks below another.
Requirement 4a: Continental Shelf
The continental shelf is the shallow, gently sloping submerged edge of a continent. Even though it is underwater, it is still part of the continent itself. Shelves are often rich fishing areas because sunlight reaches the water, nutrients can mix in, and life is abundant.
What to show on your drawing
Draw the continental shelf as the broad, shallow platform just offshore before the steep drop begins.
Requirement 4b: Continental Slope
The continental slope is the steeper region beyond the shelf. It marks the transition from shallow continental edge to deep ocean basin. On your drawing, it should look like the part where the seafloor angles downward much more sharply.
What to show on your drawing
Make the slope noticeably steeper than the shelf so the difference is easy to see.
Requirement 4c: Abyssal Plain
The abyssal plain is a broad, deep, relatively flat part of the ocean floor. “Flat” is relative — it is still deep, dark, and huge — but compared with mountains, ridges, and trenches, it is one of the smoothest large regions on Earth.
What to show on your drawing
After the continental slope, draw a wide flatter section in the deep ocean basin.
Feature Placement Guide
Where each major seafloor feature usually belongs- Shelf: shallow and near the coast.
- Slope: steep drop beyond the shelf.
- Abyssal plain: broad deep basin.
- Canyon: cut into the shelf or slope.
- Oceanic ridge: raised mountain chain in the deep ocean.
- Rift valley: depression running along some ridges.
- Trench: deepest narrow low point.
Comparing Ocean Depths and Mountain Heights
This part surprises many people. The tallest mountains on land and the deepest trenches in the ocean are in the same general scale. Mount Everest rises about 29,000 feet above sea level. The Mariana Trench reaches deeper than 36,000 feet below sea level. That means parts of the ocean are deeper than Everest is tall.
Next you will shift from landforms to the chemistry of seawater itself.
Req 5 — Seawater Chemistry
Seawater is much more than “water with salt in it.” It is a chemical mixture that carries minerals, dissolved gases, and nutrients needed by living things. This requirement helps you see the ocean as a giant chemical system that is always changing.
What Is in Seawater?
Main salts
The biggest dissolved salt in seawater is sodium chloride, the same basic combination found in table salt. Other important dissolved ions include magnesium, sulfate, calcium, and potassium.
You do not need to memorize a chemistry textbook. The key idea is that seawater contains a mix of dissolved ions, and sodium and chloride make up the largest share.
Main gases
The main gases dissolved in seawater include:
- oxygen — needed by most marine animals
- carbon dioxide — used by photosynthetic organisms and important in ocean chemistry
- nitrogen — present in dissolved form as part of the ocean’s chemical balance
Main nutrients
The most important nutrients for ocean productivity are usually:
- nitrate
- phosphate
- silicate
These nutrients help fuel the growth of phytoplankton and other marine plants or plant-like organisms.
Seawater Composition (website) A simple breakdown of the major salts and dissolved substances found in seawater. Link: Seawater Composition (website) — https://www.marinebio.net/marinescience/02ocean/swcomposition.htmImportant Properties of Water
Water has several unusual properties that make life on Earth possible.
Water can store a lot of heat
Water warms and cools slowly. That helps the ocean moderate climate and keeps marine environments from changing temperature too suddenly.
Water is a good solvent
A solvent is a substance that dissolves other substances. Water can dissolve many salts, gases, and nutrients, which is why seawater can carry so much chemistry.
Ice floats
Solid water is less dense than liquid water, so ice floats. That protects aquatic life because lakes and seas freeze from the top down instead of turning into solid blocks.
Water molecules stick together
This property, called cohesion, helps form droplets and surface tension. It matters in everything from waves to how tiny organisms interact with the water surface.
🎬 Video: Why is the Sea Salty? (video) — https://youtu.be/SPF6cSan6tc
How Marine Life Changes Ocean Chemistry
Ocean plants and animals do not just live in seawater. They actively change it.
Photosynthesis
Phytoplankton and marine plants use carbon dioxide and release oxygen. That changes the balance of dissolved gases.
Respiration
Animals, plants, and microbes also respire, using oxygen and releasing carbon dioxide. So oxygen levels and carbon dioxide levels can rise or fall depending on time of day, water depth, and how much life is present.
Shell and skeleton building
Many marine organisms, such as corals and shellfish, use dissolved calcium and carbonate to build hard parts. That changes local chemistry too.
Decomposition
When organisms die and decay, microbes break them down. This process can release nutrients back into the water and use up dissolved oxygen.
Evaporation, Precipitation, and Salinity
Evaporation removes water but leaves dissolved salts behind. That usually makes seawater saltier.
Precipitation adds fresh water. That usually makes seawater less salty.
River runoff and melting ice also lower salinity, while sea-ice formation can increase salinity in nearby water because salts are left behind in the liquid water.
What Changes Salinity?
Think about whether water is removed or added- Evaporation increases salinity because water leaves and salts stay.
- Rain decreases salinity because fresh water is added.
- River input decreases salinity near coasts and estuaries.
- Melting ice decreases salinity because it adds fresh water.
The next requirement moves from chemistry to biology. You will see how seawater properties shape the living groups that fill the ocean food web.
Req 6 — Life in Seawater
For marine life, seawater is not just a place to live. Its temperature, salt content, light levels, oxygen, and movement decide where organisms can survive. This requirement is about the living side of oceanography and the major groups scientists use to organize ocean life.
Biologically Important Properties of Seawater
Salinity
Marine organisms are adapted to certain salt ranges. A fish or invertebrate that does well in normal seawater may struggle in an estuary where fresh river water lowers salinity.
Temperature
Temperature affects metabolism, growth, migration, and where organisms can live. Coral reefs, for example, depend on fairly warm water, while polar organisms are adapted to cold conditions.
Dissolved oxygen
Animals need oxygen in the water just as land animals need oxygen in air. Low-oxygen water can stress or kill marine organisms.
Light
Sunlight powers photosynthesis, but only the upper layer of the ocean gets enough light for most phytoplankton growth. That is why the surface zone is so important to food webs.
Nutrients
Nutrients such as nitrate and phosphate act like fertilizer for marine producers. Areas where nutrient-rich deep water rises can become especially productive.
Three Big Groups of Ocean Life
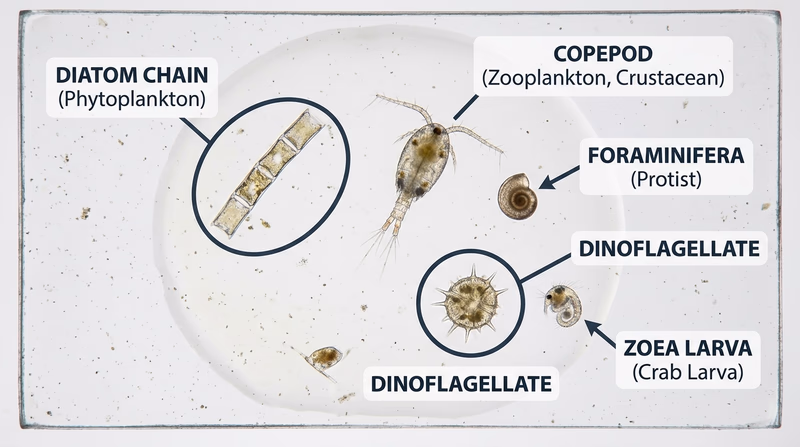
Plankton
Plankton are organisms that drift with currents more than they swim against them. Some are tiny plants or plant-like organisms, and some are tiny animals. Examples include phytoplankton, copepods, and the drifting young stages of many larger animals.
Nekton
Nekton are active swimmers that can move through the water on purpose. Fish, squid, dolphins, sea turtles, and whales are all examples of nekton.
Benthos
Benthos are organisms that live on or in the seafloor. Sea stars, clams, crabs, sea cucumbers, anemones, and many worms are benthic organisms.
🎬 Video: Nekton, Benthos, and Plankton (video) — https://youtu.be/4cguoY4qTXA
How to Tell the Groups Apart
Ask where the organism spends most of its time- Drifting in the water? Plankton.
- Swimming strongly? Nekton.
- Living on or in the bottom? Benthos.
Examples You Can Mention
Plankton examples
- diatoms
- dinoflagellates
- copepods
- krill
Nekton examples
- tuna
- sharks
- dolphins
- squid
- sea turtles
Benthos examples
- sea stars
- crabs
- clams
- corals
- sea anemones
Why Phytoplankton Matter So Much
Phytoplankton are tiny photosynthetic organisms drifting in the upper ocean. Even though each one is microscopic, together they are one of the most important foundations of life on Earth.
They matter because they:
- make organic food from sunlight, carbon dioxide, and nutrients
- feed zooplankton, which then feed larger animals
- support marine food chains all the way up to fish, seabirds, and whales
- produce a large share of Earth’s oxygen
- help move carbon from the atmosphere into ocean systems
🎬 Video: Feeding the Sea: Phytoplankton Fuel Ocean Life (video) — https://youtu.be/AWfebk0_auY
🎬 Video: NASA | Earth Science Week: The Ocean's Green Machines (video) — https://youtu.be/H7sACT0Dx0Q
Connecting Chemistry to Biology
This requirement also connects strongly to Req 5. If seawater loses nutrients, gets too warm, or has too little oxygen, marine life changes too. Oceanography works best when you connect physical conditions and chemical conditions to living systems.
Next you get to choose a hands-on project and use oceanography in action.
Req 7 — Choose an Ocean Investigation
You must choose exactly one investigation for this requirement. Each option teaches real oceanography, but they use different tools and different kinds of evidence.
Your Options
- Req 7a — Catch & Identify Plankton: Build a simple plankton net, collect a sample, and identify common drifters. This option gives you hands-on experience with marine biology and field sampling.
- Req 7b — Build a Coral Reef Model: Make physical models showing how a volcanic island can develop fringing reefs, barrier reefs, and finally an atoll. This option helps you understand reef formation and Darwin’s theory.
- Req 7c — Track Water Conditions: Measure water temperature, air temperature, turbidity, cloud cover, and surface conditions over five days. This option is great if you like data collection and graphing.
- Req 7d — Model Sediment Movement: Build a model coastline and show how waves, tides, and littoral currents move sand. This option focuses on coastal geology.
- Req 7e — Build a Wave Tank: Create a wave generator and test reflection, refraction, and the effects of coastal structures. This option is best if you enjoy experiments.
- Req 7f — Track Satellite Images: Monitor satellite images of one location for three weeks and explain what changed. This option is best for pattern-spotters who like weather and remote sensing.
How to Choose
Choosing Your Investigation
Pick the option that best fits your tools, time, and interests- Best for field biology: 7a gets you outside collecting a real sample and looking at life under magnification.
- Best for hands-on model building: 7b and 7d both involve building models, but 7b focuses on reef formation while 7d focuses on shoreline change.
- Best for measurement and graphing: 7c gives you a small dataset you can analyze over time.
- Best for physics experiments: 7e helps you see wave behavior directly.
- Best for computer-based observation: 7f uses online imagery and patience over three weeks instead of a one-day activity.
- What you will gain: 7a builds sampling skills, 7b teaches long-term geologic change, 7c strengthens data habits, 7d explains coastal landforms, 7e makes wave behavior visible, and 7f develops remote-observation skills.
Whichever option you choose, take clear notes and save evidence like sketches, graphs, photos, or observation logs. Your counselor will want to see what you actually did, not just hear a quick summary later.
Req 7a — Catch & Identify Plankton
This option turns you into a field biologist. Instead of only reading about plankton, you collect a real sample and discover what tiny drifting life is present in your local water.
Build a Simple Net
A plankton net works by filtering a lot of water through fine mesh. You do not need professional equipment. A homemade net can work well enough for this requirement if it is sturdy and fine enough to trap small drifting organisms.
A simple design usually includes:
- a bottle or small collection cup at the narrow end
- fine mesh or nylon material shaped into a cone
- a ring or hoop to hold the mouth open
- string or cord for towing
🎬 Video: How to Make a Soda Bottle Plankton Net (video) — https://youtu.be/e-MYhWcWWXw
🎬 Video: Make Your Own Plankton Net! (video) — https://youtu.be/HBcuGbMc8cU?si=c6sGRZYkRXv9QDtE
Collecting Your Sample
Tow or hold the net in moving water for about 20 minutes. The goal is not speed. The goal is to let enough water pass through the mesh to trap organisms.
Good places include:
- a dock or pier
- shallow wading access
- a gentle current in a stream
- a slow tow from a rowboat
Examining the Sample
Pour a little of the collected material into a shallow clear container or onto a slide. Use a microscope if possible, but a high-power hand lens may help with larger plankton too.
Look for differences in:
- shape
- movement
- size
- color
- body parts such as spines, shells, or appendages
You may not identify each organism to an exact species, and that is okay. For this requirement, focus on the three most common types you see. For example, you might notice copepods, algae-like phytoplankton, or tiny larvae.
What to Bring to Your Counselor
Bring evidence that shows your process:
- a photo or sketch of your net
- notes on where and how you sampled
- a list or sketches of the three most common plankton types
- any photos taken through the microscope, if you have them
This page focused on drifting life. The next option shifts from tiny organisms to the long geologic story of coral reef formation.
Req 7b — Build a Coral Reef Model
This option is about slow change over a very long time. Your model should show how a coral reef can begin around a volcanic island and end up as a ring-shaped atoll after the island sinks or erodes away.
Darwin’s Basic Idea
Charles Darwin proposed that coral reefs can grow upward while the volcanic island beneath them slowly subsides. In his model:
- a volcanic island rises above sea level
- corals grow around the shore, forming a fringing reef
- the island slowly sinks, but the reef keeps growing upward, forming a barrier reef with a lagoon between reef and island
- eventually the island disappears below sea level, leaving a ring-shaped atoll around a lagoon
The key idea is that reef growth and island subsidence happen together over time.
🎬 Video: Coral Reefs: Types and Formation (video) — https://youtu.be/mPA9Ze16lGw?si=pVw56hFgRlnPJtro
🎬 Video: How Coral Reefs are Formed (video) — https://youtu.be/anDSRfSY7LQ
What Your Model Series Should Show
Instead of one model, think of this as three stages.
Stage 1: Fringing reef
Show coral growing close to the shoreline of the volcanic island.
Stage 2: Barrier reef
Show the island lower than before, with a wider lagoon between the island and reef.
Stage 3: Atoll
Show the island gone from above sea level, leaving a reef ring and central lagoon.
What to Label on the Models
Make the science easy to see- volcanic island
- coral reef
- lagoon
- changing sea level relationship
- which stage is fringing reef, barrier reef, or atoll
Building Tips
Clay works well because you can shape the island and reef line clearly. A board base helps keep each stage stable. Use different colors for land, reef, and water so your counselor can see the transition quickly.
What to Explain When You Present It
Your counselor will likely care as much about your explanation as the model itself. Be ready to say:
- why coral reefs start near shallow sunlit water
- why the reef can keep growing upward
- why the lagoon becomes more obvious in the barrier reef stage
- why the final atoll can remain after the island is gone from view
Next, the focus shifts from long-term reef growth to short-term measurements you can record and graph.
Req 7c — Track Water Conditions
This option is a real field study. You are not trying to get a perfect laboratory dataset. You are learning how repeated observations reveal patterns that one quick measurement would miss.
What You Will Measure
Four times each day for five days, record:
- surface water temperature
- midwater temperature
- bottom temperature
- air temperature
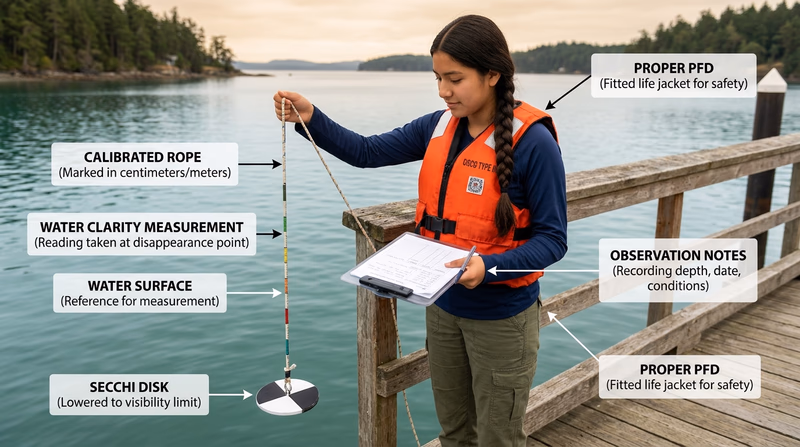
- turbidity with a Secchi disk
- cloud cover
- roughness of the water
That gives you enough information to compare conditions over time.
A Simple Sampling Plan
Try to measure at about the same times each day, such as morning, late morning, afternoon, and evening. Consistency matters more than picking a “perfect” time.
Use the same location each day if possible. If you change sites, your data becomes harder to compare.
🎬 Video: How to Make and Use a Secchi Disk (video) — https://youtu.be/lr66G09PuKg
Measuring Depth and Temperature
A thermometer on a string, a probe, or another safe temperature tool can help you sample at different depths. A rock tied to a line can help you estimate total depth so you know where midwater and bottom measurements should be.
For example, if the water is 6 feet deep:
- surface = near the top
- midwater = about 3 feet down
- bottom = just above the bottom sediment
Understanding Turbidity
Turbidity tells how cloudy the water is because of suspended particles. A Secchi disk helps you judge how deep you can still see a marked disk in the water. Lower visibility usually means higher turbidity.
Turbidity can change because of:
- muddy runoff after rain
- wind stirring sediment
- algae growth
- boat traffic or wave action
Graphing Your Results
Make graphs for air temperature, water temperature, and turbidity. You might use:
- one graph with separate lines for surface, midwater, bottom, and air temperature
- one separate graph for turbidity over time
The point is to make patterns visible. Did the surface warm fastest? Did cloudy days keep temperatures lower? Did turbidity change after windy conditions?
Questions to Ask Your Data
Use these when you discuss your results- Was the surface usually warmer than deeper water?
- Did water temperature track air temperature closely or more slowly?
- Did cloudy weather seem to change the pattern?
- Was turbidity stable or did it jump on certain days?
The next option leaves data logging behind and moves to a model of shoreline change.
Req 7d — Model Sediment Movement
Coastlines are always moving, even when they look still. This option helps you model how sand and sediment shift because of waves, tides, and currents.
What Your Model Should Demonstrate
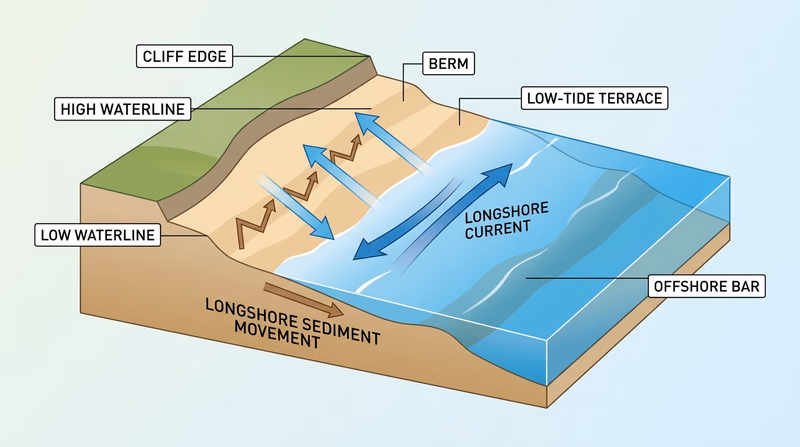
Your model should show that sediment is not fixed in one place. Waves move it up and down the shore. Littoral currents move it along the shore. Tides change where water reaches. Stormy conditions can tear down sandbars that calm conditions later rebuild.
Key features to include
- high waterline
- low waterline
- low-tide terrace
- berm
- coastal cliffs
- offshore bars
🎬 Video: Longshore Drift Model Demo (video) — https://youtu.be/bfzAeQXhSGk
Useful Terms
A littoral current moves parallel to the shore and can carry sand along the beach.
A berm is the raised ridge of sand or gravel built by wave action above the normal waterline.
A low-tide terrace is the flatter exposed area you may see at low tide.
An offshore bar is a ridge of sand built underwater or just offshore by waves and sediment transport.
Building the Model
A tray or shallow box works well. Use sand, clay, or damp soil for land and beach forms, and water to show how movement happens.
Try to build:
- a sloping beach
- one higher edge to represent a coastal cliff
- a low offshore sand ridge
- markers for high and low tide lines
Then use small waves or repeated pours to show how sediment can move.
What to Explain to Your Counselor
Do not only show the finished model. Explain the processes:
- how waves push and pull sediment
- how an angled wave approach can move sand downshore
- how tides change where erosion and deposition happen
- how offshore bars can build up during some conditions and be torn down during others
The next option keeps the water-motion theme but switches to a focused wave experiment.
Req 7e — Build a Wave Tank
This option lets you see wave behavior instead of just imagining it. A ripple tank or shallow wave tray can make reflection, refraction, and the effect of coastal structures visible in just a few minutes.
Build a Simple Wave Generator
A shallow clear tray, pan, or plastic bin can work as your tank. You need enough water to make small waves and enough room to place barriers or sloping bottoms.
You can generate waves by:
- gently tapping the water with a flat piece of plastic
- moving a small board up and down
- using repeated finger taps at one end
🎬 Video: DIY Ripple Tank (video) — https://youtu.be/9l-tIvvtCPA
🎬 Video: Wave Tank Demonstration (video) — https://youtu.be/3yNoy4H2Z-o?si=spekLgWh6z3YHC8W
Reflection
Reflection happens when a wave hits a barrier and bounces back. In your tank, a straight wall or block can show reflected wave patterns.
🎬 Video: Reflecting Waves in a Ripple Tank (video) — https://youtu.be/iGuUKRmytLw
Refraction
Refraction happens when waves change speed and direction because part of the wave enters shallower water first. In your tank, you can place a shallow object under one side of the wave path to bend the incoming wave fronts.
🎬 Video: Refraction of Waves in a Ripple Tank (video) — https://youtu.be/7wfEczDapHA
Coastal Structures
Groins
A groin sticks out from shore and is meant to trap sand moving along the beach.
Jetties
Jetties are larger structures, often built near inlets or harbors, to help control water flow and reduce sediment buildup in channels.
Breakwaters
A breakwater is built offshore or near shore to reduce wave energy in the protected area behind it.
In your model, use blocks or barriers to represent these structures and watch how wave patterns change around them.
🎬 Video: Coastal Erosion and the Methods Used to Reduce It (video) — https://youtu.be/_eeKpz8oD7E
What to Watch in the Tank
Notice these pattern changes as you test structures- Do waves bounce straight back or scatter?
- Does the wave front bend when it reaches shallow water?
- Is wave energy reduced behind the breakwater?
- Does one side of a groin trap more sediment in your model?
The final Req 7 option steps away from tanks and models and uses satellite images to study change from above.
Req 7f — Track Satellite Images
This option makes you an ocean observer from space. Instead of collecting one sample at one moment, you follow the same location over three weeks and look for changing patterns.
Pick a Good Location
Choose a place where the ocean or coast is active enough to reveal change. Good choices include:
- a tropical storm or hurricane region
- a stretch of coastline affected by surf or sediment plumes
- an estuary where river water meets the sea
- a region known for cloud bands, sea-surface patterns, or changing storms
The most important choice is consistency. Stick with one location long enough to notice what changes and what stays the same.
Weather Satellite Images (website) NOAA satellite imagery that lets you monitor storms, cloud patterns, and ocean regions over time. Link: Weather Satellite Images (website) — https://www.nhc.noaa.gov/satellite.phpWhat to Record
Each time you check the images, write down:
- date and time
- what location you viewed
- major cloud patterns
- storm position or growth, if relevant
- any obvious changes from the previous image
- questions you have about what you are seeing
Questions to Ask the Images
Use these prompts to turn watching into investigation- Is the same weather pattern still present or has it shifted?
- Do cloud bands look tighter, weaker, or more organized?
- Is sediment or runoff visible near the coast?
- Are waves, storms, or fronts affecting the same region repeatedly?
How to Tell Your Counselor What You Learned
By the end of three weeks, do more than say “I watched satellite images.” Explain the pattern.
For example, you might say:
- the coast looked different after storms than during calm periods
- cloud systems followed a repeated track
- one storm strengthened over warm water and weakened later
- the same location showed changing turbidity or plume patterns after runoff
This finishes the hands-on investigation choices. Next you will choose a way to report what you learned through reading, visiting, or speaking.
Req 8 — Choose a Reporting Project
You must choose exactly one path for this requirement. Each option asks you to turn oceanography learning into a report or presentation, but the kind of experience is very different.
Your Options
- Req 8a — Read and Report on a Book: Read one counselor-approved oceanography book and write a 500-word report. This option is best if you like research and careful note-taking.
- Req 8b — Visit an Ocean Science Site: Visit either a research ship or a marine lab, institute, or aquarium, then write a 500-word report. This option is best if you learn well by seeing real places and equipment.
- Req 8c — Give an Oceanography Speech: Prepare and give a five-minute speech on why oceanography matters or on careers in the field. This option is best if you like speaking and organizing ideas clearly.
How to Choose
Choosing Your Reporting Project
Think about the kind of evidence and skill each option develops- Time at home: 8a is easiest to do mostly at home once your counselor approves the book.
- Field experience: 8b gives you the strongest look at real-world ocean science settings.
- Public speaking practice: 8c builds confidence in preparing and delivering a short talk.
- What you will gain: 8a strengthens reading and summarizing, 8b builds observation and interview-style note-taking, and 8c improves explanation and communication.
The overview page for 8b goes one level deeper because it includes a second choice between two kinds of visit. Keep that in mind if you are leaning toward the visit option.
Req 8a — Read and Report on a Book
A good book report does more than prove you read something. It shows that you can pull out the main ideas, explain what you learned, and connect the book to the badge.
Choose the Right Book
Start by asking your counselor to approve a book before you begin. The best choices are books that clearly connect to ocean science, not just a random story that happens near water.
Strong choices might include books about:
- deep-sea exploration
- coral reefs or marine ecosystems
- ocean currents and climate
- famous research expeditions
- marine biology or ocean technology
Take Notes While You Read
Do not wait until the end and try to remember everything. Keep simple notes on:
- the main topic of the book
- the most important facts or discoveries
- new vocabulary
- surprising examples or stories
- questions the book made you think about
What a Strong 500-Word Report Includes
Use this structure to stay organized- Introduction: What book did you read, and what is it about?
- Main ideas: What are the biggest science concepts or discoveries in the book?
- What you learned: What was new or surprising to you?
- Why it matters: How does the book help explain the ocean or oceanography better?
- Closing thought: Would you recommend it, and why?
Go Beyond Summary
Your counselor will probably care most about what you understood. If your report only retells the chapters, it may sound flat. Add your own thinking.
For example, you might explain:
- how the book connected to Req 2 on currents or climate
- how it helped you understand phytoplankton or food webs from Req 6
- how it changed your view of ocean exploration from Req 9
Before You Turn It In
Read the report aloud once. That is the fastest way to catch awkward wording, repeated ideas, or places where you forgot to explain a term.
The next option is more hands-on: visiting a real ocean science site and writing about what you observe there.
Req 8b — Visit an Ocean Science Site
You must choose exactly one visit option for this requirement. Both options help you see oceanography as a real working field, but they highlight different parts of the job.
Your Options
- Req 8b1 — Tour a Research Ship: See how scientists collect samples and data at sea. This option is great if you want to understand field operations and shipboard tools.
- Req 8b2 — Visit a Marine Lab or Aquarium: Visit a place where marine life, instruments, experiments, or public education are part of the daily work. This option is great if you want a broader look at ocean science careers and research spaces.
How to Choose
Choosing Your Visit
Think about access, experience, and what you want to learn- Harder to access: Research ships are exciting but less common to tour.
- Easier to find: Aquariums, marine labs, and institutes are often more available.
- What you will gain: A ship visit shows how science happens in the field, while a lab or aquarium visit shows how science is studied, explained, and shared on land.
- Best evidence for your report: Take notes on tools, people, questions, and one thing that surprised you.
Req 8b1 — Tour a Research Ship
A research ship is like a floating science lab. It is not only transportation. It is a place where scientists deploy instruments, collect samples, map the seafloor, and process data while still at sea.
What to Look For on a Ship
During your visit, pay attention to how the ship supports science. Look for:
- cranes or winches for lowering instruments
- deck space for equipment and sample handling
- onboard labs
- sonar or mapping systems
- navigation and weather tools
- living and working spaces for crew and scientists
🎬 Video: Tour of a Research Vessel (video) — https://youtu.be/LVDQi5iG99M
Questions Worth Asking
If you can talk to staff, ask questions like:
- What kinds of missions does this ship support?
- What instruments are most important on board?
- How long do scientists stay at sea?
- What jobs are done by crew members versus scientists?
- What kind of data is collected on a typical trip?
Writing the Report
Your 500-word report should describe more than the fact that you visited. Explain what the ship is designed to do and why that matters to oceanography.
You might focus on:
- one instrument you found especially interesting
- how ship design supports safe science work
- the teamwork needed between crew and scientists
- what kind of ocean questions the ship helps answer
The next visit option shifts from work at sea to work in a lab, institute, or aquarium.
Req 8b2 — Visit a Marine Lab or Aquarium
This option lets you see ocean science in a place built for research, teaching, conservation, or animal care. A marine lab and an aquarium are not exactly the same, but both can reveal how people study and explain the ocean.
What to Watch For
At a marine lab or institute, notice:
- research equipment
- sample storage or wet lab spaces
- maps, sensors, and data displays
- what kinds of questions scientists are studying
At an aquarium, notice:
- how exhibits explain habitats and food webs
- how animal care depends on water quality and observation
- how the aquarium teaches the public about conservation and ocean science
🎬 Video: A Virtual Tour of Bodega Marine Laboratory (video) — https://youtu.be/DYI_gw72bk8?si=2GDdWk4RX68hyIK5
🎬 Video: A Visit to Mote Marine Laboratory & Aquarium (video) — https://youtu.be/aaY1fwyjU1U
Questions to Ask
- What kinds of projects happen here?
- How do scientists collect samples or data?
- What careers are represented in this place?
- How does this organization help people understand or protect the ocean?
The final option in Req 8 changes from writing about a visit to giving a short speech on oceanography’s value or career paths.
Req 8c — Give an Oceanography Speech
This option is about explaining ocean science clearly to other people. A five-minute talk is not very long, so your job is to organize your ideas and choose a few strong examples instead of trying to say everything.
Choose Your Angle
You have two good directions.
Why oceanography is important
This works well if you want to focus on weather, climate, food webs, coastlines, storms, and how people depend on the ocean.
Career opportunities in oceanography
This works well if you want to show the range of jobs in the field, such as marine biologist, physical oceanographer, chemical oceanographer, geologist, engineer, data analyst, educator, or remotely operated vehicle operator.
🎬 Video: Oceanography Careers (video) — https://youtu.be/uFHREUrMLSY
🎬 Video: How to Work with the Ocean (video) — https://youtu.be/N4d6YRKEaxg
Build a Clear Outline
Your counselor must approve the outline before the speech, so keep it simple and readable.
A strong outline might look like this:
- opening hook
- two or three main points
- one memorable example for each point
- closing idea that sticks with the audience
Example hook ideas
- “The ocean helps control the weather in places that are hundreds of miles from the coast.”
- “Tiny phytoplankton help support the air we breathe.”
- “Oceanography is not one job — it is a whole team of sciences working together.”
Speech Prep Checklist
Before you stand up to speak- Write a simple outline, not a wall of text.
- Get your counselor’s approval first.
- Practice aloud with a timer.
- Define scientific terms in plain language.
- End with one strong takeaway the audience will remember.
Make It Sound Like You
A speech is stronger when it sounds spoken, not copied from a report. Short sentences work well. So do vivid examples. If you talk about careers, explain what those people actually do. If you talk about importance, connect the ocean to storms, oxygen, climate, seafood, or exploration.
The final requirement asks you to step back and look at the tools and methods marine scientists use to investigate the ocean itself.
Req 9 — Tools of Ocean Science
The ocean is too big, too deep, and too dark to study with one tool. Marine scientists use many methods, each answering a different kind of question.
Method 1: Direct Sampling
Scientists collect actual material from the ocean so they can study it closely. That can include water samples, sediment cores, plankton tows, rock samples, or biological specimens.
This method is powerful because it gives real physical evidence. If you want to measure salinity, identify plankton, or examine mud from the seafloor, you need a sample.
Method 2: Remote Sensing
Remote sensing means gathering information without standing in the exact place being measured. Satellites are a major example. They can monitor sea-surface temperature, storm patterns, ocean color, and even large-scale current patterns.
Aircraft, drones, and some ship-mounted instruments also count as remote-sensing tools.
Method 3: Sonar and Seafloor Mapping
Scientists use sound waves to map the seafloor and detect objects underwater. This is especially important because light does not travel far in deep or murky water.
Sonar can help scientists:
- measure depth
- map ridges, canyons, and trenches
- locate shipwrecks
- study the shape of the seafloor
Method 4: Underwater Vehicles and Observatories
Marine scientists use remotely operated vehicles, autonomous underwater vehicles, submersibles, and fixed observing stations. These tools can go deeper and stay longer than human divers.
They can carry cameras, sensors, sampling arms, and measuring equipment into places that are otherwise difficult to study.
🎬 Video: Studying the Ocean EXPLAINED (video) — https://youtu.be/ibPuzpHuAgY
🎬 Video: How do Scientists Explore the Deep Sea? (video) — https://youtu.be/vKzgIyCTY8k?si=gAsNKqiPyHLcwXys
Other Useful Methods You Might Mention
You only need four, but marine scientists also use:
- scuba diving and underwater observation
- laboratory experiments
- long-term moored buoys
- computer models that test how systems may behave
A Strong Way to Explain These Methods
When describing the four methods to your counselor, pair each one with the kind of question it answers.
For example:
- sampling answers “What is this made of?”
- remote sensing answers “What pattern is happening over a large area?”
- sonar answers “What shape is under the water?”
- underwater vehicles answer “What is happening in places people cannot easily reach?”
That kind of explanation shows understanding, not just memorization.
You have now completed the main requirements. The final section goes beyond the badge and points you toward real-world ocean learning.
Extended Learning
Congratulations
You just worked through a badge that stretches from tiny drifting plankton to global climate and from beach waves to deep trenches. That range is exactly what makes oceanography exciting: the ocean is one connected system, and every scale matters.
Tracking Change in a Living Ocean
One strong next step is to learn how scientists recognize change over time instead of relying on one dramatic moment. A coral reef, an estuary, or a stretch of coastline can look stable on one day and tell a very different story across months or years. Oceanographers build that bigger picture by comparing repeated measurements, satellite images, and long-term observations.
Why the Deep Sea Changes the Way Scientists Think
The deep ocean is cold, dark, and under crushing pressure, yet it still holds active ecosystems and surprising geology. Hydrothermal vents, methane seeps, and deep coral habitats remind scientists that life can survive in places once thought nearly impossible. If you enjoyed the mystery side of this badge, deep-sea exploration is a natural next topic.
Oceanography and Coastal Communities
Ocean science is not only about faraway expeditions. It also helps coastal communities prepare for storms, erosion, flooding, fisheries changes, and water-quality issues. If you want to see oceanography in everyday life, study the coast as a place where science and public decisions meet.
Real-World Experiences
Visit a Coastal Visitor Center or NOAA Facility
Join a Beach, River, or Estuary Cleanup
Tour an Aquarium Behind the Scenes
Track a Storm or Coastal Event Over Time
Organizations
NOAA Ocean Exploration
NOAA Ocean Exploration Expeditions, maps, videos, and stories from U.S. ocean exploration projects. Link: NOAA Ocean Exploration — https://oceanexplorer.noaa.gov/Woods Hole Oceanographic Institution
Woods Hole Oceanographic Institution Research, deep-sea technology, and public education from one of the world's leading ocean science institutions. Link: Woods Hole Oceanographic Institution — https://www.whoi.edu/Monterey Bay Aquarium Research Institute
Monterey Bay Aquarium Research Institute Ocean research, underwater robotics, and deep-sea discoveries with strong public-facing science resources. Link: Monterey Bay Aquarium Research Institute — https://www.mbari.org/Schmidt Ocean Institute
Schmidt Ocean Institute Modern exploration expeditions, remotely operated vehicle dives, and seafloor mapping projects around the world. Link: Schmidt Ocean Institute — https://schmidtocean.org/Now that you have finished the full guide, the printable companion is ready when you want one page you can review offline or bring to a meeting.