Req 7c — Track Water Conditions
This option is a real field study. You are not trying to get a perfect laboratory dataset. You are learning how repeated observations reveal patterns that one quick measurement would miss.
What You Will Measure
Four times each day for five days, record:
- surface water temperature
- midwater temperature
- bottom temperature
- air temperature
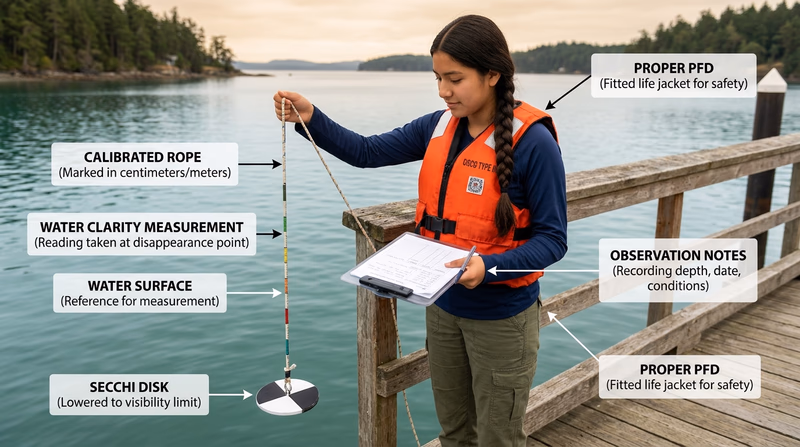
- turbidity with a Secchi disk
- cloud cover
- roughness of the water
That gives you enough information to compare conditions over time.
A Simple Sampling Plan
Try to measure at about the same times each day, such as morning, late morning, afternoon, and evening. Consistency matters more than picking a “perfect” time.
Use the same location each day if possible. If you change sites, your data becomes harder to compare.
🎬 Video: How to Make and Use a Secchi Disk (video) — https://youtu.be/lr66G09PuKg
Measuring Depth and Temperature
A thermometer on a string, a probe, or another safe temperature tool can help you sample at different depths. A rock tied to a line can help you estimate total depth so you know where midwater and bottom measurements should be.
For example, if the water is 6 feet deep:
- surface = near the top
- midwater = about 3 feet down
- bottom = just above the bottom sediment
Understanding Turbidity
Turbidity tells how cloudy the water is because of suspended particles. A Secchi disk helps you judge how deep you can still see a marked disk in the water. Lower visibility usually means higher turbidity.
Turbidity can change because of:
- muddy runoff after rain
- wind stirring sediment
- algae growth
- boat traffic or wave action
Graphing Your Results
Make graphs for air temperature, water temperature, and turbidity. You might use:
- one graph with separate lines for surface, midwater, bottom, and air temperature
- one separate graph for turbidity over time
The point is to make patterns visible. Did the surface warm fastest? Did cloudy days keep temperatures lower? Did turbidity change after windy conditions?
Questions to Ask Your Data
Use these when you discuss your results
- Was the surface usually warmer than deeper water?
- Did water temperature track air temperature closely or more slowly?
- Did cloudy weather seem to change the pattern?
- Was turbidity stable or did it jump on certain days?
The next option leaves data logging behind and moves to a model of shoreline change.