Req 2a — The Electromagnetic Spectrum
This requirement asks you to create a visual map of the radio spectrum — the range of frequencies that carry everything from AM broadcast to Wi-Fi. You’ll draw a chart, label the major frequency bands, and place at least eight real radio services on it. By the end, you’ll be able to look at any frequency and know roughly what lives there.
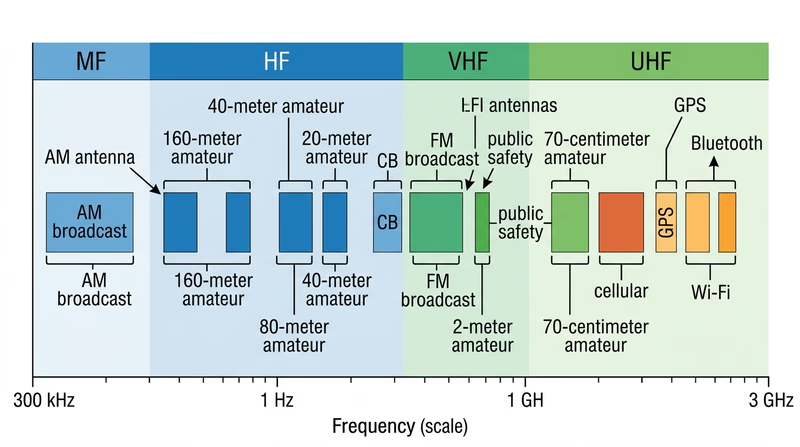
Requirement 2a1: Draw the Spectrum Chart
Your chart should show frequencies from 300 kHz (the low end of the medium-frequency band) to 3,000 MHz (the upper edge of the UHF band, which is also the start of microwaves). That’s a factor of 10,000 in frequency — so you’ll want to use a logarithmic scale rather than a linear one.
How to Set Up Your Chart
- Draw a horizontal axis along the bottom of a sheet of paper (landscape orientation works best).
- Mark the following frequency points spaced roughly equally along the axis: 300 kHz, 1 MHz, 3 MHz, 10 MHz, 30 MHz, 100 MHz, 300 MHz, 1,000 MHz (1 GHz), 3,000 MHz (3 GHz).
- Each step is roughly a factor of 3, which keeps the spacing even on a log scale.
- Label the axis “Frequency” and include units (kHz / MHz / GHz).
Requirement 2a2: Label the Frequency Bands
The International Telecommunication Union (ITU) divides the radio spectrum into named bands. Here are the five you need to label on your chart:
| Band | Abbreviation | Frequency Range | Key Characteristic |
|---|---|---|---|
| Medium Frequency | MF | 300 kHz – 3 MHz | AM broadcast, ground-wave propagation |
| High Frequency | HF | 3 MHz – 30 MHz | Shortwave, long-distance skywave propagation |
| Very High Frequency | VHF | 30 MHz – 300 MHz | FM broadcast, TV channels 2–13, public safety |
| Ultra High Frequency | UHF | 300 MHz – 3,000 MHz | TV channels 14+, cellular, Wi-Fi, GPS |
| Microwave | — | 3,000 MHz and above | Satellite links, radar, 5G mmWave |
Color-code or shade each band on your chart so the boundaries are visually clear.
Requirement 2a3: Locate Eight Radio Services
Place at least eight of these services on your chart at their correct frequency ranges. You must include at least four amateur radio bands. Here’s a reference table:
| Service | Approximate Frequency | Band |
|---|---|---|
| AM broadcast | 535 kHz – 1,705 kHz | MF |
| 160-meter amateur | 1.8 – 2.0 MHz | MF |
| 80-meter amateur | 3.5 – 4.0 MHz | HF |
| 40-meter amateur | 7.0 – 7.3 MHz | HF |
| 20-meter amateur | 14.0 – 14.35 MHz | HF |
| Citizens Band (CB) | 26.965 – 27.405 MHz | HF |
| 10-meter amateur | 28.0 – 29.7 MHz | HF |
| TV channels 2–6 | 54 – 88 MHz | VHF |
| FM broadcast | 88 – 108 MHz | VHF |
| 2-meter amateur | 144 – 148 MHz | VHF |
| Public safety | 150 – 174 MHz / 450 – 470 MHz | VHF/UHF |
| TV channels 7–13 | 174 – 216 MHz | VHF |
| 70-cm amateur | 420 – 450 MHz | UHF |
| Cellular (4G/5G) | 700 – 2,600 MHz | UHF |
| GPS | 1,227 – 1,575 MHz | UHF |
| Wi-Fi | 2,400 – 2,483 MHz | UHF |
| Bluetooth | 2,400 – 2,483 MHz | UHF |
Tips for a Good Chart
- Use arrows or brackets to show that a service spans a range, not just a single point.
- Label clearly — small text next to each service mark, with a line pointing to its position on the frequency axis.
- Four amateur bands is the minimum. If you have room, adding all six listed above shows real depth.
- Your counselor will want to see that you understand where things live in the spectrum and why — lower frequencies travel farther but carry less data; higher frequencies carry more data but need line-of-sight.
With your spectrum chart complete, you have a visual map of the radio world. Next, you’ll define what “radio” actually means and learn the difference between broadcast and two-way communication.