Req 4d2 — Map the Logic
A flowchart is a picture of your robot’s thinking. It helps you show the order of actions, the decision points, and what happens when the sensor sees one thing instead of another. This option is great because it proves you understand the logic even if you are not presenting full code.
What a strong robotics flowchart includes
A useful flowchart does more than show a straight line from start to finish. It should include:
- a start point
- one or more actions such as drive forward, lift arm, or stop motor
- one or more decision diamonds based on sensor input
- arrows showing what happens for yes/no or true/false results
- a clear end or repeat loop
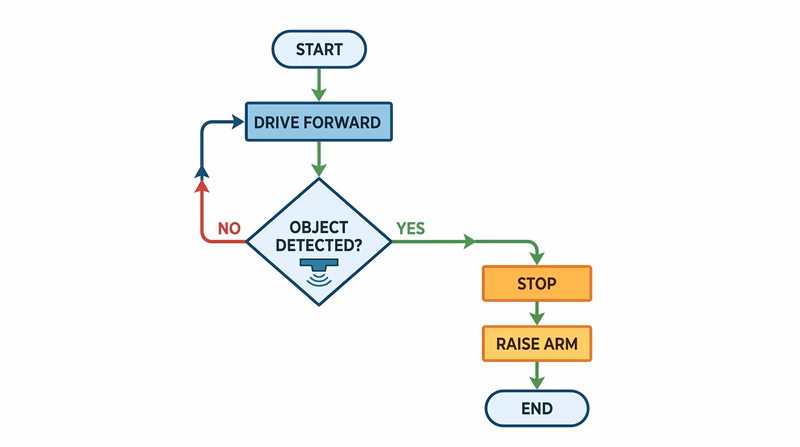
For example, your chart might say:
- Start
- Drive forward
- Read distance sensor
- Obstacle detected?
- Yes → stop → raise arm → end
- No → keep driving → check again
That is real robotic logic because the next step depends on input from the world.
🎬 Video: General Guide to Creating Flowcharts (video) — https://youtu.be/SWRDqTx8d4k
🎬 Video: Flowchart Tutorial for Beginners (video) — https://youtu.be/c8asK8iCaRk
Use standard shapes clearly
You do not need advanced diagram software. Pencil and paper is fine if it is neat. What matters is that the symbols make sense.
- Oval: start or end
- Rectangle: an action or process
- Diamond: a decision
- Arrow: direction of flow
If you use those shapes consistently, your counselor can follow your robot’s plan quickly.
Flowchart quality check
Make sure your logic is easy to follow
- The mission from Req 4a is obvious from the chart.
- Sensor inputs appear in decision points, not just in a note on the side.
- Every decision has a clear outcome path.
- The chart does not skip major actions.
- Someone else could use the chart to write code later.
Whether you chose code or a flowchart, the next step is the same: test the robot, record the results, and learn from what happened.